The Scripting User Interface
The following sections describe the ADS-related user interface components of TopBraid EDG.
These script-related panels can be opened from the Panels button in the header of TopBraid EDG.
Hint
Over time, you may want to define and save your own layout for script development to match your typical script development workflows.
Script Editor Panel
The Script Editor panel is the primary place to write and execute scripts. It contains a powerful JavaScript editor (using Microsoft’s Monaco editor) with full syntax highlighting and similar auto-complete features that professional development tools such as VS Code have.
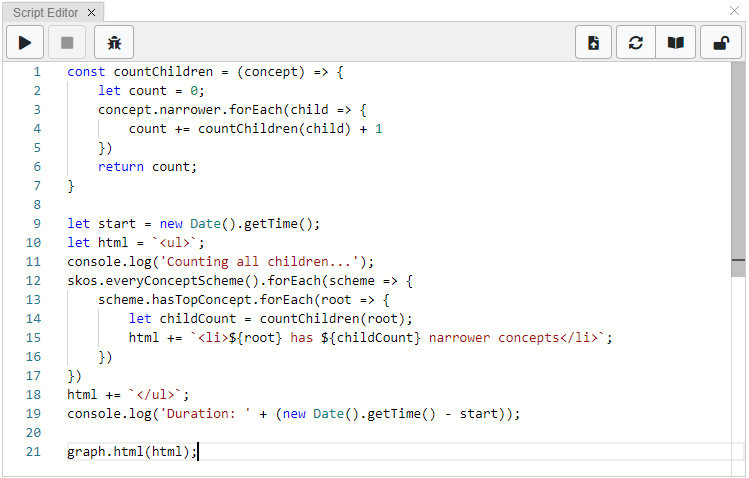
The Script Editor panel
In case you would like to try out the script above, open the Geography Taxonomy from the TopBraid EDG Samples and copy and paste this:
 1const countChildren = (concept) => {
 2    let count = 0;
 3    concept.narrower.forEach(child => {
 4        count += countChildren(child) + 1
 5    })
 6    return count;
 7}
 8
 9let start = new Date().getTime();
10let html = `<ul>`;
11console.log('Counting all children...');
12skos.everyConceptScheme().forEach(scheme => {
13    scheme.hasTopConcept.forEach(root => {
14        let childCount = countChildren(root);
15        html += `<li>${root} has ${childCount} narrower concepts</li>`;
16    })
17})
18html += `</ul>`;
19console.log('Duration: ' + (new Date().getTime() - start));
20
21graph.html(html);
Executing Scripts
Use the Execute button to run this script.
Hint
Use Ctrl-Enter as a keyboard alternative for the Execute button.
If successful, this will open the Script Results Panel.
Note
If you cannot edit the script, the administrator may have disabled using ADS for the governance role of your user account. On TopBraid EDG Studio, you are the administrator.
Alternatively, you can execute the script in debug mode, which would open the Script Debugger Panel.
Note
The button Run script in debugger is currently only available in TopBraid EDG Studio.
Tip
If you accidentally launch a script that does not seem to terminate, try to stop it from the Process Management page that can be reached from the Administration page. In the worst case, restart TopBraid EDG Studio.
Read-only mode versus Read/write mode
By default, the Script Editor panel will operate in read-only mode. In this mode the API will not support operations that would modify the data, allowing you to safely query the data without accidental damage. Use the Allow script to make changes to the data “unlock” button to switch to read/write mode.

Use the Unlock button to allow the script to make changes to the data
In that mode additional functions will become available and the Preview button will appear, allowing you to perform a dry-run of the changes before applying them for real.
Refreshing the API
If someone has made changes to an Ontology, the generated ADS APIs may become out of date. The system does not invalidate and re-generate those APIs after each change, as this may keep the system too busy. Instead, use the Refresh button to make sure that all APIs are up to date. This will not immediately re-generate all APIs but reset all APIs so that they will get re-generated the next time they are requested.
For typical ontologies, re-generating an API will only take in the 100s of milliseconds.
The focusNode variable
In the Script Editor panel, the special variable focusNode will be pre-assigned to the asset (resource) that is currently selected on the Form panel.
The system will try to use the best suitable JavaScript class as type for the focusNode variable.
For example, when you select g:Africa (which is an RDF instance of g:Continent which is a subclass of g:GeoConcept which is a subclass of skos:Concept)
then the variable focusNode will be an instance of the JavaScript class g_GeoConcept which is a subclass of skos_Concept:
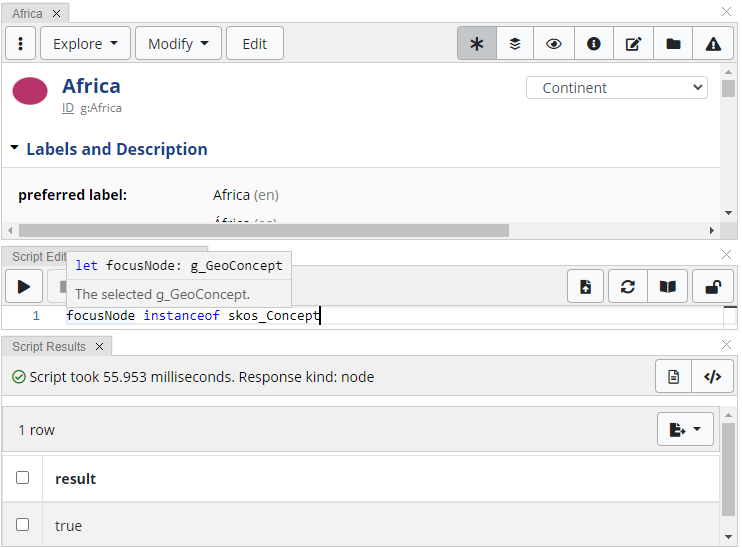
The special variable focusNode will point at the currently selected asset
The variable focusNode is also used by ADS in several other places such as node expressions.
Having it readily available in the Script Editor panel makes the testing of such ADS scripts easier.
Hint
To bind other variables with specific RDF nodes, use something like
let myNode = graph.namedNode('http://example.org/myNode');for a genericNamedNodeinstancelet concept = skos.asConcept('http://example.org/myConcept');for a specificskos_Conceptinstance
Editing dash:js scripts from the Form panel
Many ADS scripts end up being stored as value of dash:js of resources such as Resource Actions.
Editing such dash:js scripts on the Form panel is often not ideal because the Form panel is limited in size and cannot be used to execute scripts for testing purposes.
To improve those editing cycles, the Script Editor panel can be used to edit such dash:js scripts.
Whenever the selected resource of the Form panel has a dash:js, the Script Editor panel will offer a button to edit that script.
Once clicked, the dash:js script will be copied into the Script Editor panel, where you can edit it.
When done, you can elect to save your changes back as value of dash:js of the selected resource:
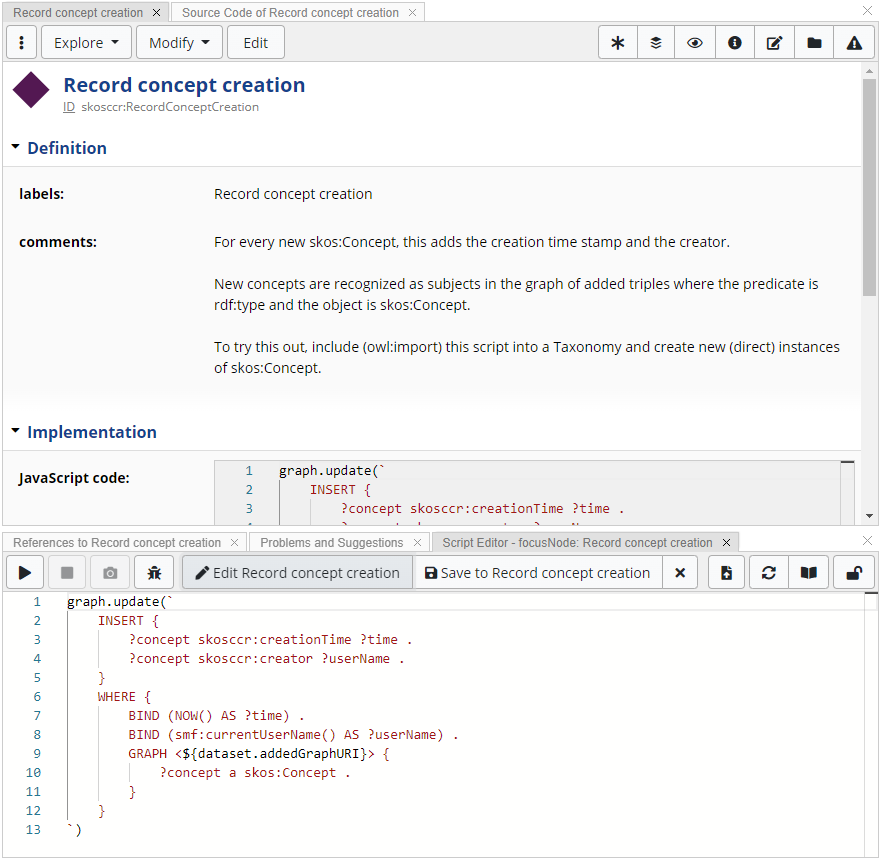
The Script Editor panel is often a good place to edit `dash:js` scripts from the Form panel
Script Results Panel
The Script Results panel will automatically open when you execute a script. It will attempt to display a suitable rendering of the result of your script, which is usually the last JavaScript expression of your program.
In the Script Editor example at the beginning of this page, the script has returned an rdf:HTML literal using the function graph.html().
For such literals, the Script Results panel will render the HTML as it would appear to end users in a web browser.
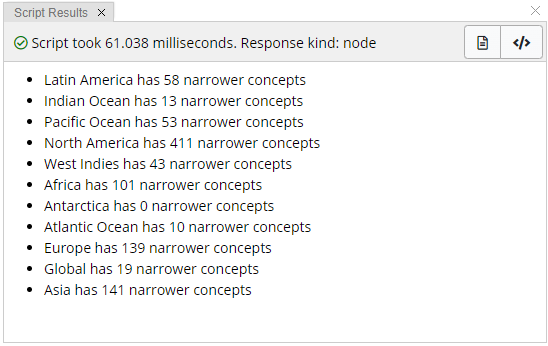
The Script Results Panel displaying an HTML snippet
The Script Results panel has dedicated modes depending on what result the script returns:
rdf:HTMLliterals are rendered as HTML in the web browserrdf:XMLLiteralliterals are rendered as XML source codeJavaScript objects are rendered using a JSON viewer
All other results are displayed using a tabular viewer, including results of SPARQL queries through
graph.select()
Alternatively, you can switch to showing the actual source code of the result with the button Show raw results.
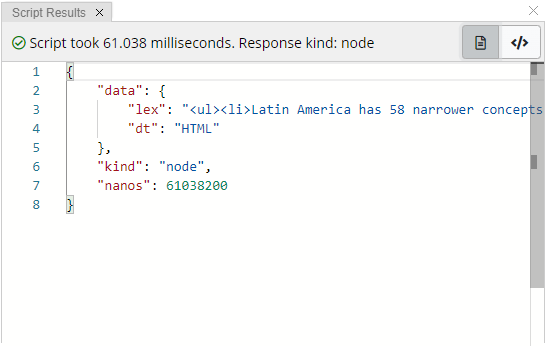
The Script Results panel displaying the raw result of a script
Script Console Panel
The Script Console panel can be opened using the Panels button.
It displays the output of calls such as console.log(...) and console.err(...).
The Script Console will accummulate all output from all scripts until the Clear Console button is pressed.
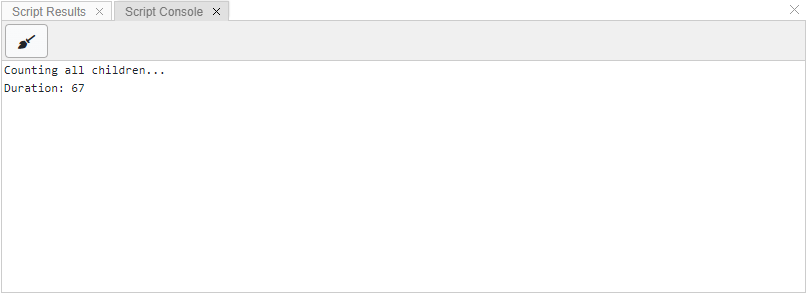
The Script Console panel can be used to inspect the output of console.log()
Hint
The Script Console is great for debugging scripts where the Script Debugger Panel cannot be used. This included scripts that are executed automatically from outside of the Script Editor such as Change and Commit Scripts, and outside of TopBraid EDG Studio.
Power users and Administrators can use the Capture output from all consoles to also see output created by scripts
started by other users. This includes scenarios where a script is started in the background, e.g. as a dash:CommitScript
and you need to trace its output for debugging purposes.
Script Debugger Panel
The Script Debugger panel can be launched from the Script Editor Panel and, indirectly, using Explore > Debug Script. The debugger is currently available in TopBraid Studio only because it installs some low level hooks into the GraalVM engine that may affect other scripts, and because we don’t want to have to deal with stale debugging sessions on a live production server.
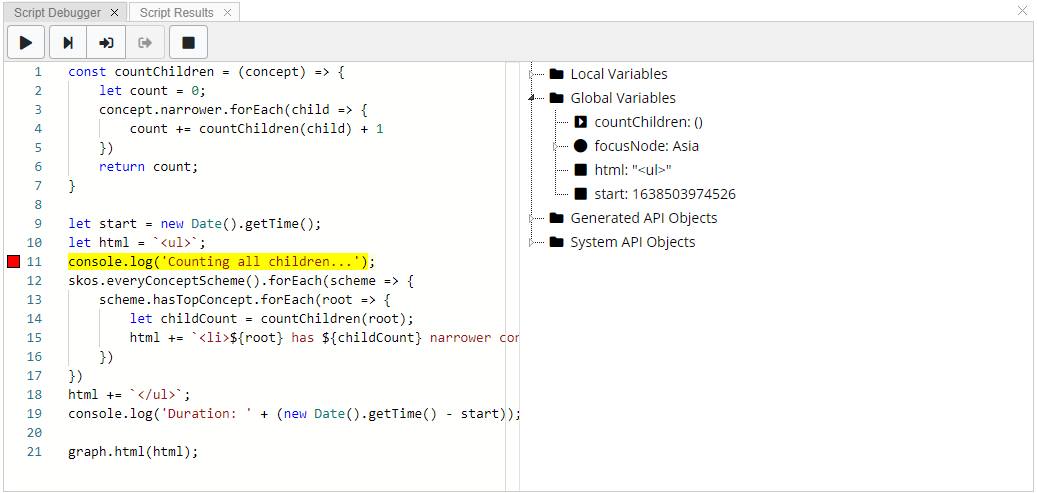
The Script Debugger panel can be used walk through an executing script and inspect intermediate variable values
You can set and remove break points by clicking on the line numbers of either the Script Editor or the Script Debugger panels.

You can set and remove break points for individual lines
When you press the Debug button without setting a breakpoint first, the script will execute the first line and then stop immediately. Otherwise, it will execute until it reaches the first breakpoint.
Whenever the script is interrupted, you can use the explorer tree on the right to inspect the current values of variables.
Hint
Variables defined through let assignments on the top scope of your script will appear under Global variables.
The debugger has the “usual” buttons to resume, step over, step into, step out and terminate, that most developers will be familiar with.
Hint
The Generated API Objects and System API Objects sections may be useful to learn which API features are available for your current script.
Use the “Spider” button on the Script Editor Panel or Explore > Debug Script to debug scripts that are not called from the Script Editor panel but are called automatically, for example as a web service, a change/commit script or a SHACL rule. This will open the Script Debugger panel in a mode where it will wait for the next execution of the selected script and you can then proceed stepping through that next execution.
Script API Viewer Panel
Like most other panels, the Script API Viewer panel can be opened from the Panels button. It shows the whole ADS API for the current asset collection, including the Core API and the Auto-Generated API.
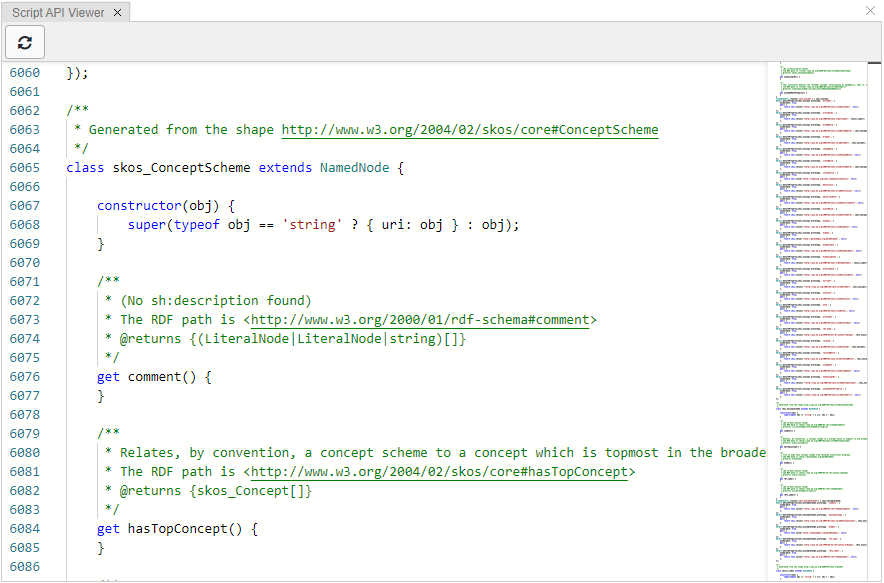
The Script API Viewer can be used to see the whole ADS API for the current asset collection
Shape Scripts Panel
The Shape Scripts panel has been described in Shape Scripts.