Using EDG Diagrams
The EDG Diagram is the latest visualization feature of EDG replacing the Class Diagram, NeighborGram and the Relationship Tree Diagram. All of those visualization features have been combined into a single one-stop shop of relationship exploration.
The EDG Diagram is a panel and users can have multiple diagrams open at the same time. However, note that large diagrams can take a lot of resources to render/animate and maintain.
Definitions:
Node: A node is an element on the diagram that represents a Class, Resource or Property Shape.
Edge: An edge is an element on the diagram that represents a relationship between nodes.
For the purposes of this document diagram elements will be referred to as Nodes and Edges.
Using Explore and then Show EDG Diagram opening the EDG Diagram Panel.
EDG Diagram Panel
Once opened, nodes can be added to the diagram by drag and drop, for example from the class hierarchy in an Ontologies collection.
The EDG Diagram panel has buttons that perform actions on the diagram.

TopBraid EDG Diagram Buttons
From left to right the buttons are:
Diagram Settings
Clear Diagram
Save Diagram
Open Diagram
Export (as GraphML, SVG, or PNG files)
Search (within diagram)
Zoom In
Zoom Out
Fit To Screen
Fixate selected nodes
Release selected nodes (from Fixate)
Undo
Redo
Toggle Overview Visibility
Expand All Nodes
Collapse All Nodes
Undo/Redo
While working with the diagram all actions can be undone or reapplied. There are only three limitations:
diagram history does not persist when the diagram is saved and reopened;
diagram history does not persist when the panel is closed;
if the diagram is reset by using the Trash button, the diagram history is cleared.
Fixate/Release selected nodes buttons can be used so that when fixated and the diagram needs to redraw/relayout, then those nodes are locked in place.
Search
Users can search for specific labels in the diagram by selecting the Search button and then entering text in the dialog. Nodes with matching labels are highlighted. Selecting the button again removes the dialog.
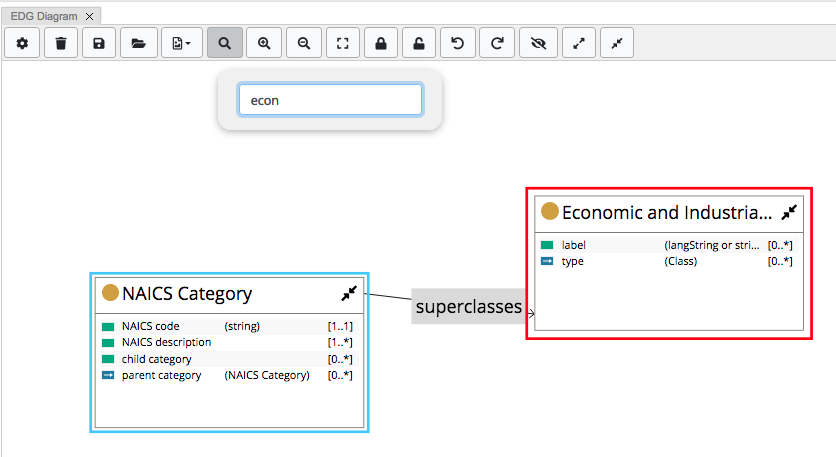
TopBraid EDG Diagram Search
Toggle Overview Visibility
The EDG Diagram has a low fidelity overview panel in the lower right corner of the diagram. Users can control the visisble nodes for very large diagrams by selecting and moving the overview rectangle. This panel is hidden by default.
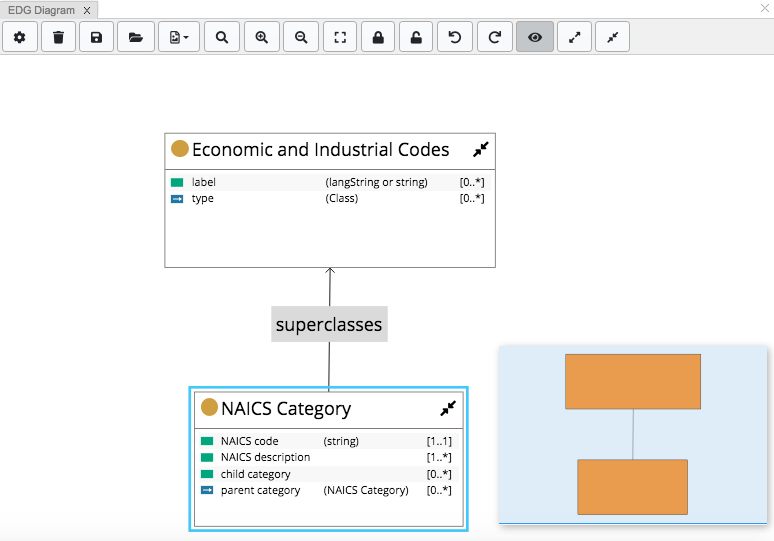
TopBraid EDG Diagram Overview
Node Types
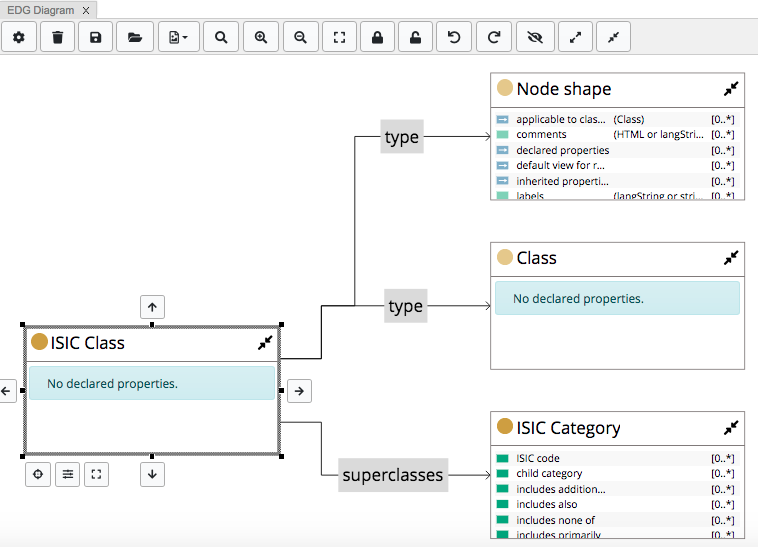
By default EDG Diagram supports three node types and their general layout is shown in the following figure. Resource Nodes, Class Nodes and Property Shape Nodes all follow this layout, but offer type-specific detailed information.
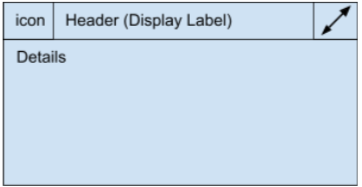
TopBraid EDG Diagram Node Types
Node Type Interaction
All three nodes have a (right-click) context menu that is only accessible through the ‘header’ of the node. This context menu is the same that is available throughout the EDG editor. However, there are now some node specific actions. These actions will vary depending on the current node type.
TopBraid EDG Diagram Node Types
Resource Node: A Resource Node is a node that represents an instance of a class. The information in a resource node is controlled by DASH Property Roles. (https://datashapes.org/propertyroles.html)
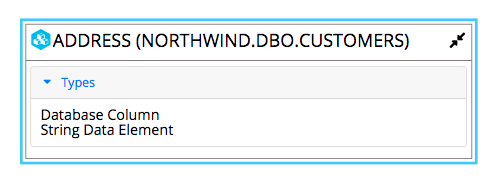
TopBraid EDG Diagram Resource Node
The following figure shows the context menu.
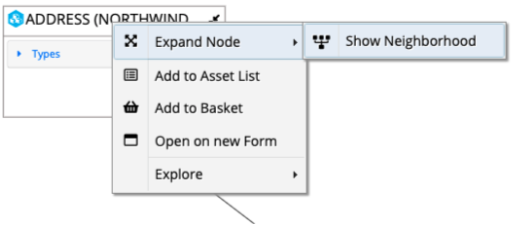
TopBraid EDG Diagram Resource Node Context Menu
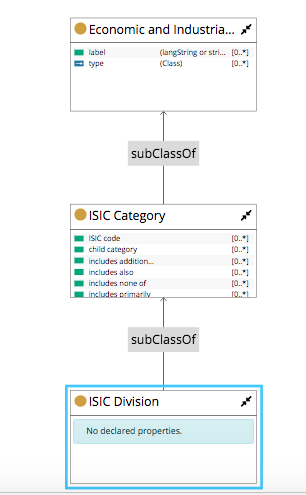
Class Node: A Class Node is a node that represents a class definition. It shows the list of declared properties. The diagram also has the ability to show inherited properties in a Class Node, controlled by a per-diagram setting.
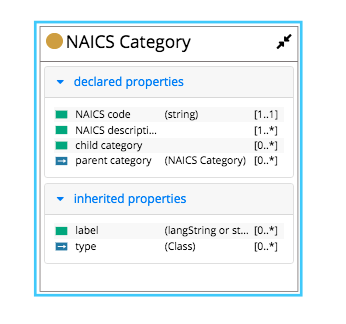
TopBraid EDG Diagram Class Node Including Inherited Properties
The following figure shows the context menu.

TopBraid EDG Diagram Class Node Context Menu
Property Shape Node: A Property Shape Node is a node that represents a property shape definition. It mirrors the editor form, rendering the property group and all properties relevant to the property shape definition.
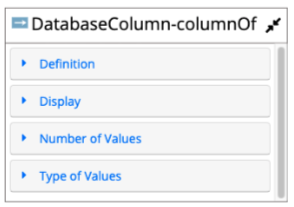
TopBraid EDG Diagram Property Shape Node
The following figure shows the context menu.
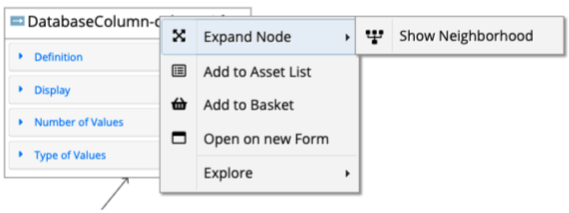
TopBraid EDG Diagram Property Shape Node Context Menu
EDG Diagram Other Expansion Options
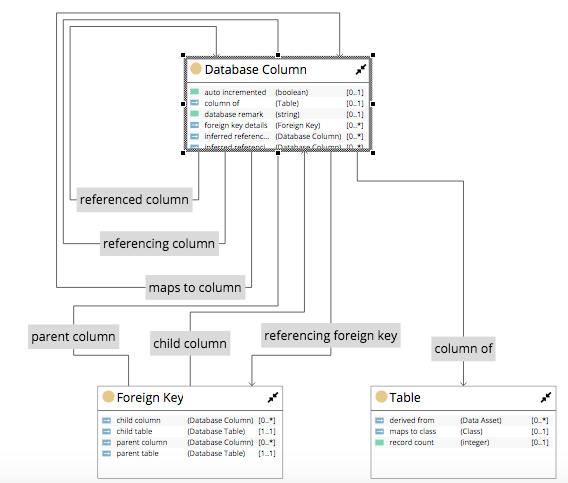
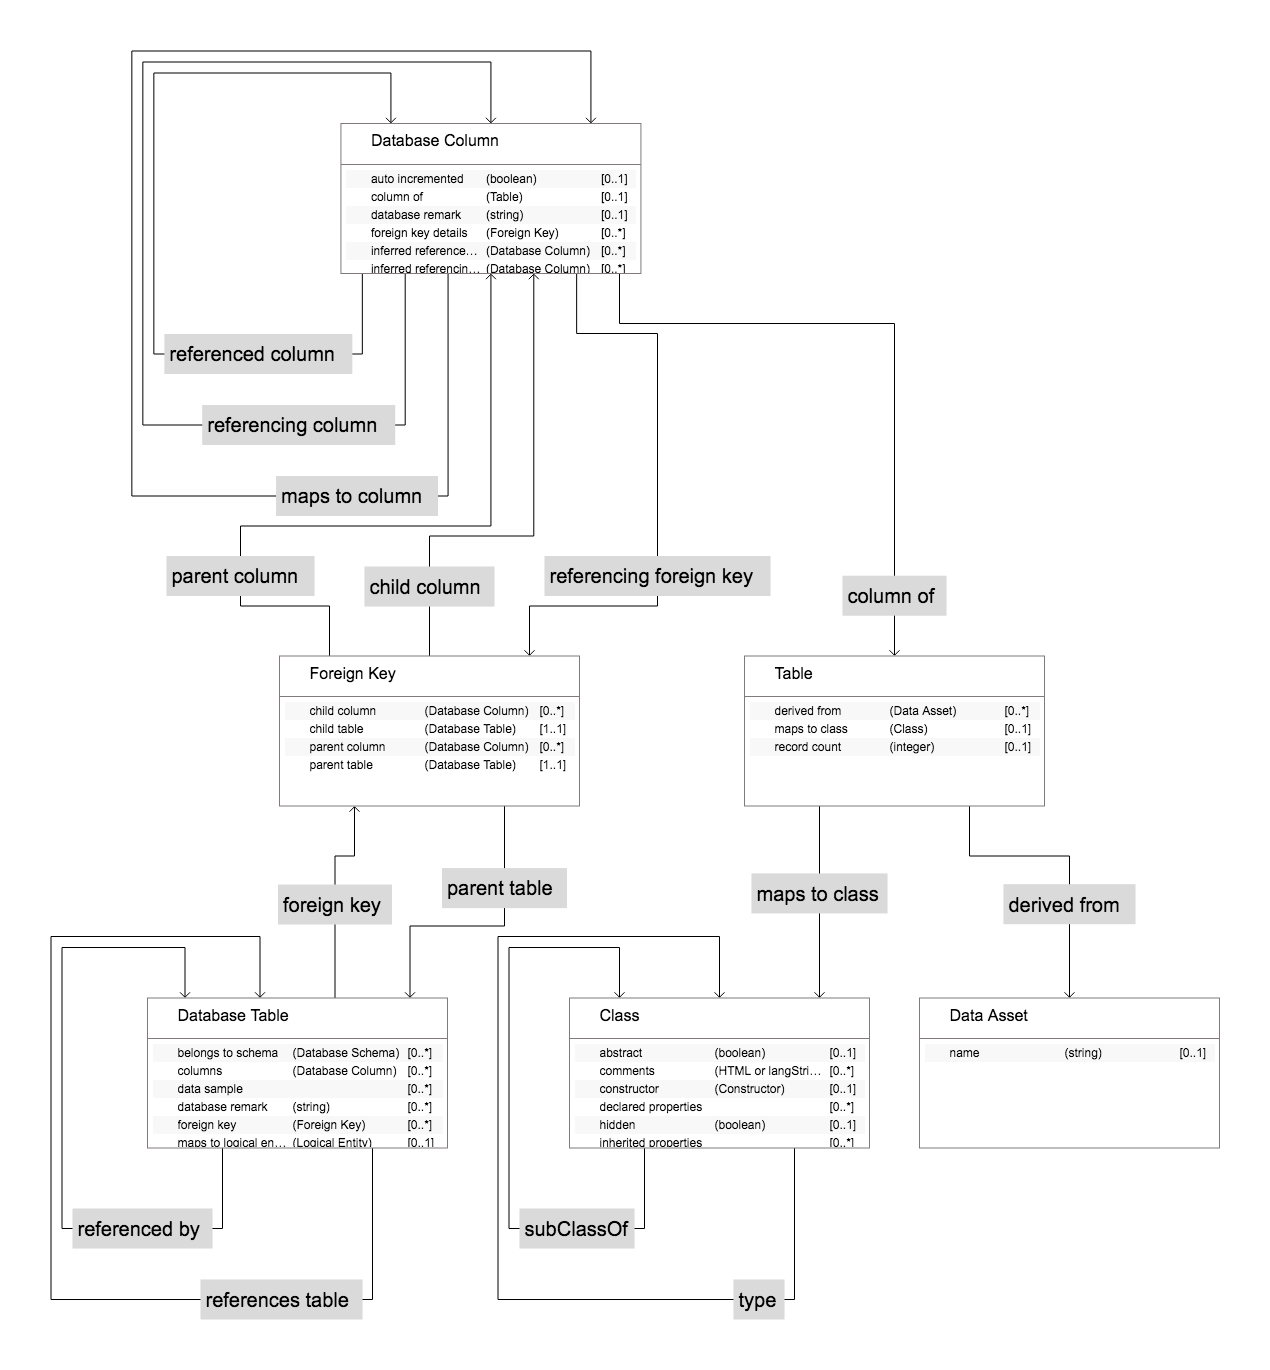
The EDG Diagram will automatically resolve relationships between existing nodes on a diagram.
Outside of the default layout algorithms each node has the ability to expand upon known relationships. This can be done in a directional manner (North: Bottom-Top, South: Top-Bottom, East: Right-Left, West: Left-Right). When selected, a node has several action buttons.
Selecting any of these buttons opens a dialog showing the available relationships. Only existing relationships will be available, not potential relationships as defined by Property Shapes. Select the target relationships and click Ok to accept. Then observe the layout of the nodes in that direction.
Once a relationship has been selected it is no longer available as a candidate for the other directions.
Focus Node in the EDG diagram means hiding elements that are not connected to the target node. The undo button can be used to revert the action.
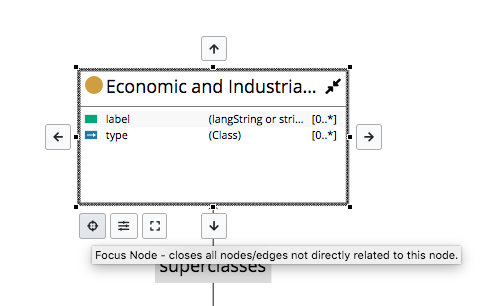
TopBraid EDG Diagram Focus Node Control
Note
Focusing on a node in the earlier EDG NeighorGram meant re-drawing the entire diagram around the new focus node.
Zoom To Node is the control used to make the selected node be the center of the diagram.
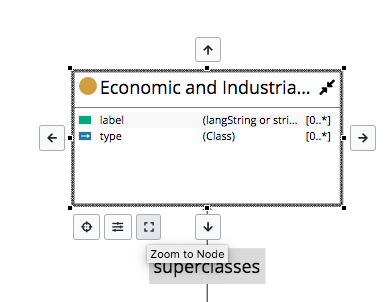
TopBraid EDG Diagram Zoom To Node Control
Hide/Show Properties is the control at the top right of the node used to hide or show properties inside the box.
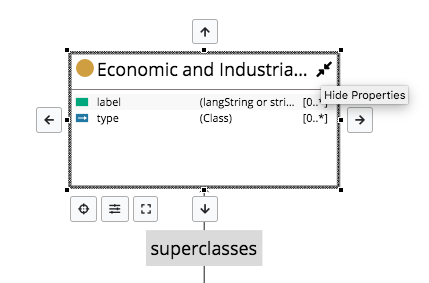
TopBraid EDG Diagram Hide Properties Control
EDG Diagram Relationship Filtering
The EDG Diagram has the ability to filter relationships. There are two filter options: global and local. If global filters are applied, local filters are possible as the number of filter combinations would become difficult to maintain.
Global Filtering is managed using the Diagram Settings dialog accessible through the gear icon in the diagram toolbar has four setting areas.
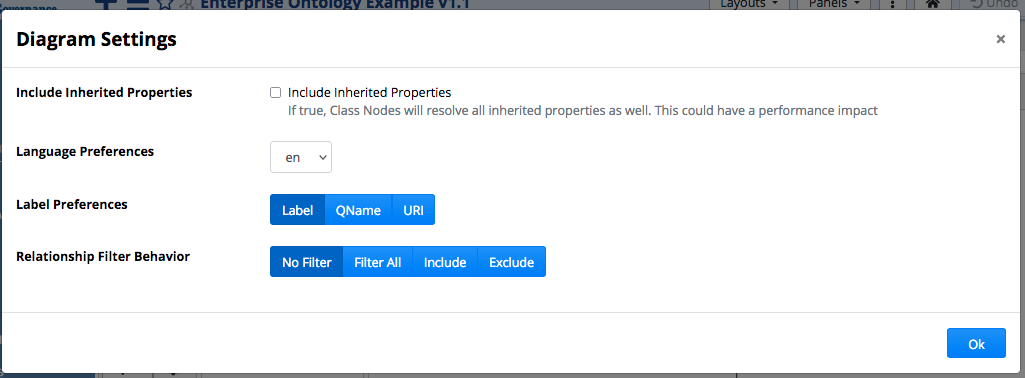
TopBraid EDG Diagram Settings
To set a relationship filter, select one of the options:
No Filter removes any filtering.
Filter All hides all relationships and properties.
Include hides all relationships except for those selected.
Exclude shows all relationships except for those selected.
Include/Exclude list all Available Properties (relationships) for the current Asset Collection.
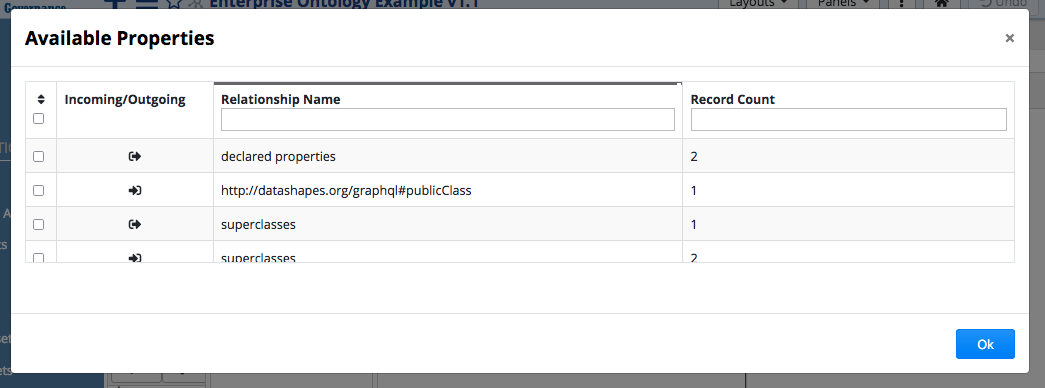
TopBraid EDG Diagram Available Properties Dialog
Local Filtering is handled by the Property Control action. It has the same options as global filters, the primary difference is that the filter only applies to the target node and relationships that are connected to the target node.
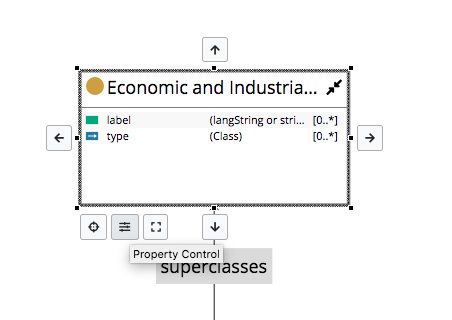
TopBraid EDG Diagram Property Control
When selected the properties of the asset are shown to be selected for filtering.
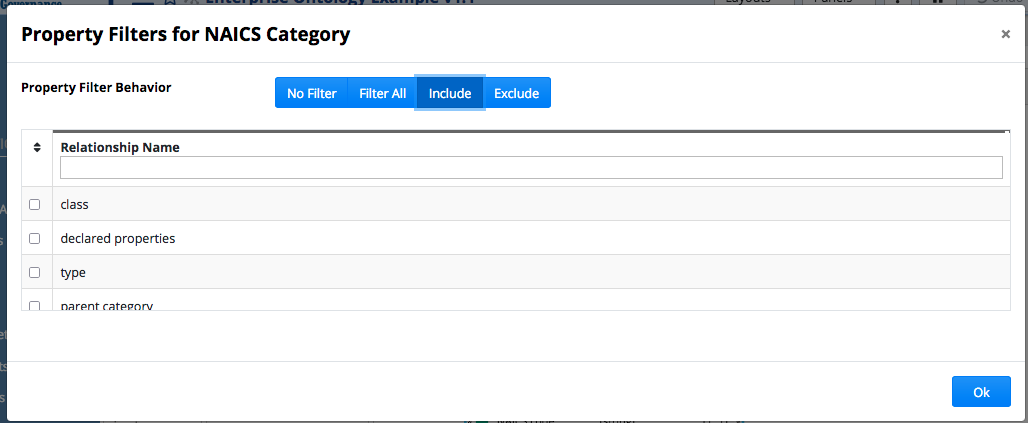
TopBraid EDG Diagram Property Filters Dialog
Property Hover Menu (Class Nodes Only)
The property hover menu presents quick actions. Properties that have a relationship with another Resource have three options:
Expand Relationship: which expands upon the target property. The default layout is bottom-to-top, expanded nodes may layout above or below the target node depending on the direction of the relationship.
Quick Hide Relationship: hides the property from the ClassNode and close any open edges/node on that relationship. If a relationship is hidden with the quick hide the global/local filters will have no effect on that relationship.
Open Menu: opens the context menu for the target property.
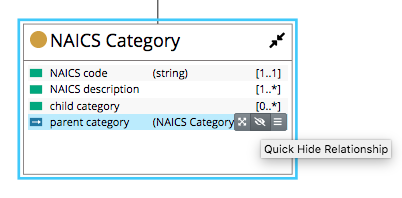
TopBraid EDG Diagram Property Hover Menu
Edge Customizations
When an edge is selected a context menu will be presented. This context menu provides the ability to customize edges. Edges can be customized several ways: color, thickness, dash style, edge style (e.g. polyline or bezier).
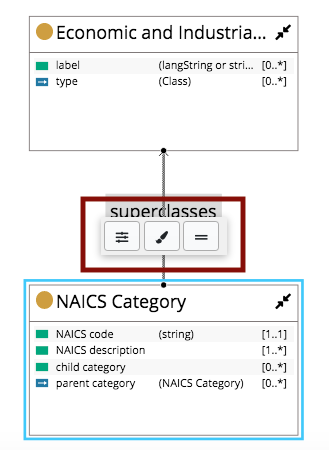
TopBraid EDG Diagram Edge Customizations
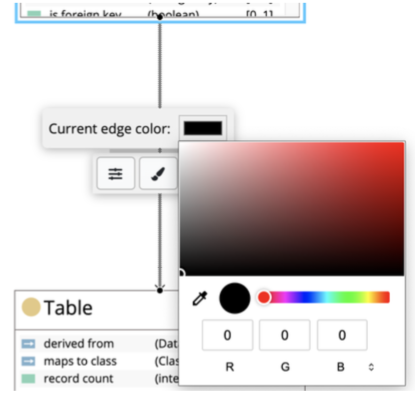
TopBraid EDG Diagram Edge Color
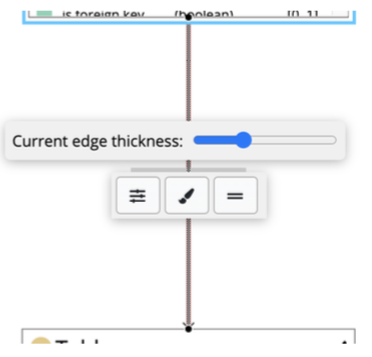
TopBraid EDG Diagram Edge Thickness
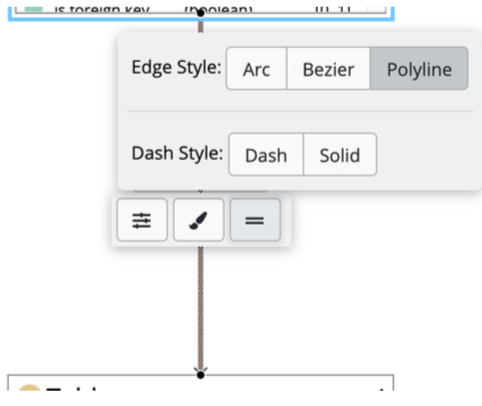
TopBraid EDG Diagram Edge/Dash Style
Removing Nodes
While not obvious nodes can be removed from the diagram. This is done by selecting the nodes and clicking the delete or backspace button. The nodes and connected edges will be removed.
Saving and Sharing
Diagrams can be saved to asset collections. This allows users to save their work, create snapshots at intervals and also share diagrams with other users. Diagrams can be marked as public or private, all public diagrams are discoverable by other users, but only the owner can make modifications.

TopBraid EDG Diagram Save Button

TopBraid EDG Diagram Save Diagram Dialog
After a diagram has been created, to share the link, select Open saved diagram to browse the available diagrams. Keep in mind that diagrams can only be viewed by EDG users.

TopBraid EDG Diagram Open Saved Diagram Button
Click the link for a specific diagram to copy it to the clipboard. Use Delete to removed the selected Saved diagram.

TopBraid EDG Diagram Open Saved Diagram Dialog
